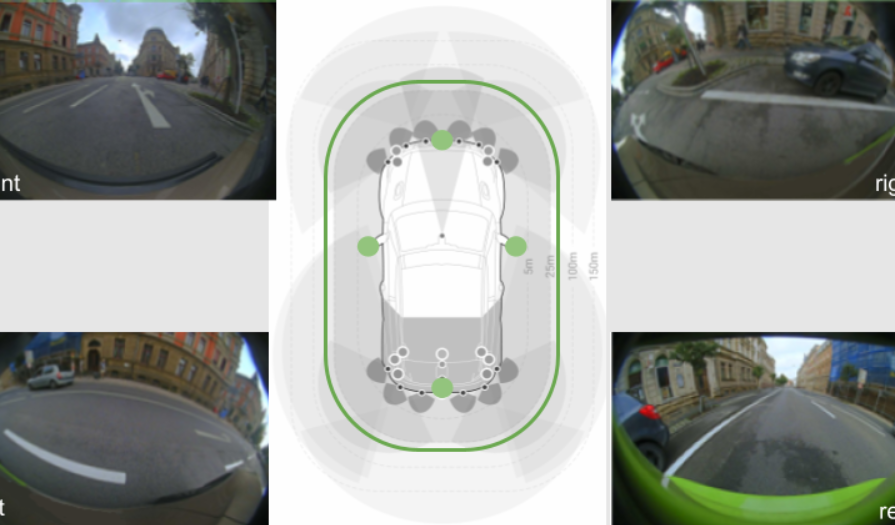
该数据集是自动驾驶领域的数据集,数据采集的时候在车身安装4个环视鱼眼镜头。并且为40多个种类超过10,000张图片提供实例标注。
数据集介绍
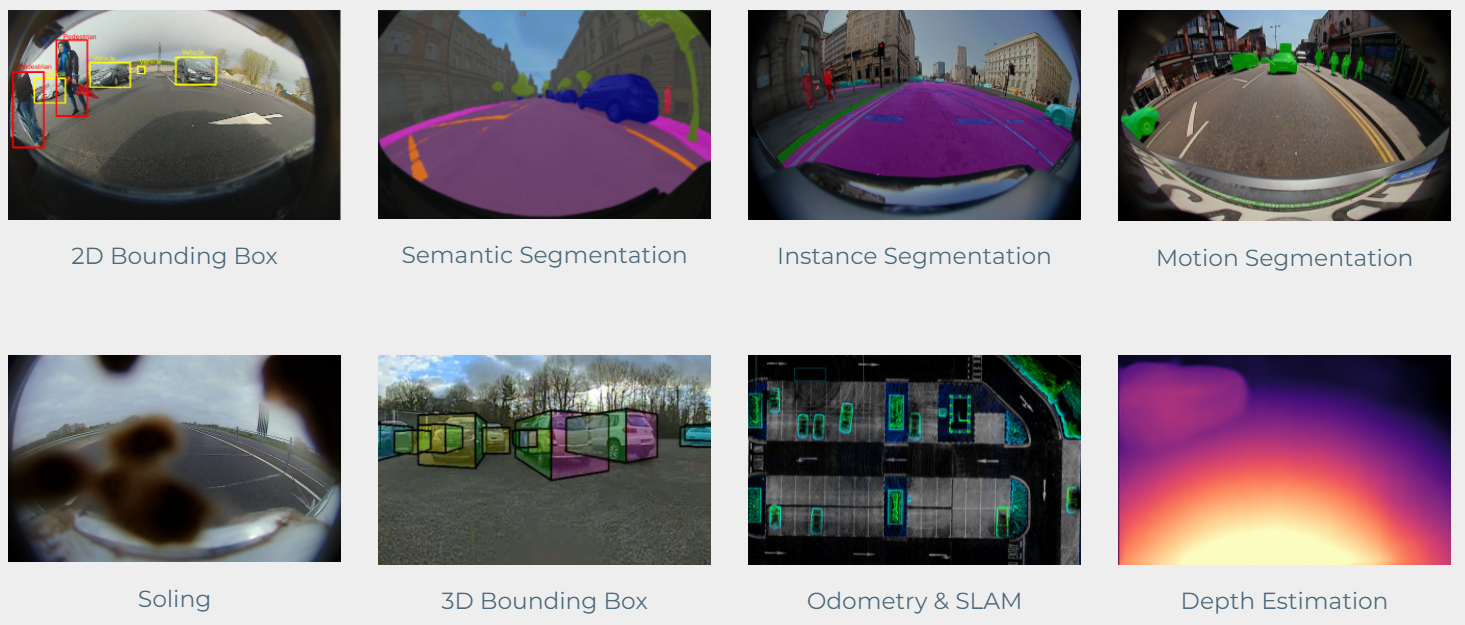
该数据集提供10,000张图片,并且专注于以下几个任务,同时该数据集提供的数据是鱼眼图像,并且数据集的作者希望我们在CV领域上直接使用鱼眼图像,数据集主页。
- 分割
- 深度估计
- 2D或者3D的带有边框的目标检测
- 运动估计
- 污浊物检测
数据集使用(用于车道线检测)
下载好数据集之后,文件目录是这个样子,我们打开WoodScape_ICCV19这个目录,然后解压缩里面的压缩包。在rgb_images-004这个目录下,我们发现有8234张图片,这些图片是用来训练的图片。需要说明的是,几个缩写代表的含义FV表示Front View、MVR表示Mirror View Right、MVL表示Mirror View Left、RV表示Rear View分别表示前视、右视、左视、后视。


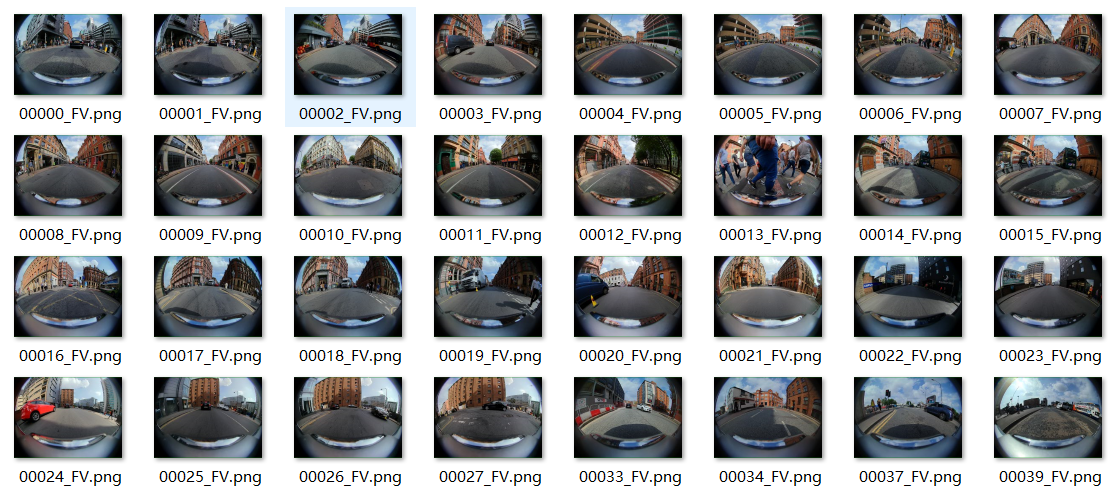
首先我们编写脚本挑出其中的前视图像,毕竟做车道线检测的我们是需要前视摄像头拍摄的图片。简单的使用python编写出脚本,挑出前视图像并将图像保存在某个路径下,脚本如下,挑完之后前视图片一共有2307张。
import os
import shutil

if __name__=='__main__':
	# 源图像所在的目录
	image_folder = 'G:\\WoodScape\\WoodScape_ICCV19\\rgb_images-004\\rgb_images'
	# 目标保存的目录
	des_folder = 'G:\\picked_data'
	# 获取图像list
	imageList = os.listdir(image_folder)
	for item in imageList:
		if item.split('_')[-1]=='FV.png':
			image_path = os.path.join(image_folder,item)
			try:
				shutil.copy(image_path,des_folder)
			except IOError as e:
				print("Unable to copy file. %s" %e)
接着我们找到数据集的标注,在instance_annotations\instance_annotations这个目录下面,这里面每个json文件就对应着每张图片的标注。我们编写相关的脚本文件来可视化我们的标注,其中lane_marking表示对车道线的标注,脚本如下:
import os
import cv2 as cv
import json,codecs
import numpy as np


if __name__=='__main__':
	file_pre = '00916_FV'
	# 标注的json文件所在路径
	json_file_path = 'G:\\LDW\\WoodScape\\WoodScape_ICCV19\\WoodScape_ICCV19-20211119T065309Z-001\\WoodScape_ICCV19\\instance_annotations\\instance_annotations\\instance_annotations\\'+file_pre+'.json'
	# 与标注对应的图片所在路径
	image_file_path = 'G:\\picked_data\\'+file_pre+'.png'
	with codecs.open(json_file_path,'r',encoding='utf-8') as cs:
		json_data = json.load(cs)
	line_list = ['lane_marking','parking_marking','parking_line']
	# line_list = ['lane_marking']
	for item in json_data[file_pre+'.json']['annotation']:
		for marking in line_list:
			if marking in item['tags']:
				arr = item['segmentation']
				image = cv.imread(image_file_path)
				arr = np.array(arr,np.int32)
				cv.fillConvexPoly(image,arr,(0,0,255))
	image = cv.resize(image,(640,483))
	cv.imshow('res',image)
	cv.waitKey()
	cv.destroyAllWindows()
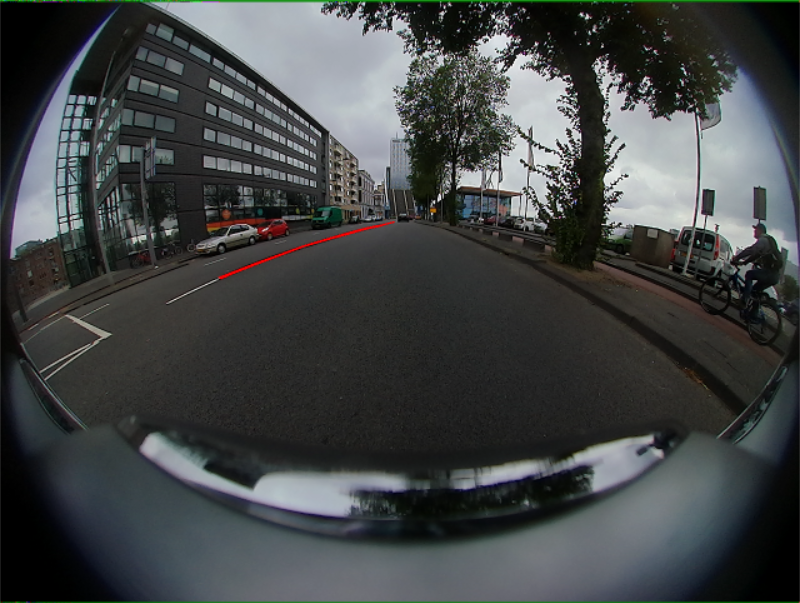
对于00916这个编号的图片而言,车道线标注在图像中的效果如下图所示,但是奇怪的是,车道线的标注只有一部分,没有完全标注完,这是我所疑惑的。在给出的label标签中,车道线的标注是给出了点的坐标,也就是车道线轮廓点的坐标,我们将坐标依次连接起来并将组合而成的闭合多边形用颜色填充即可得到标注在图像中的可视化效果。
Q.E.D.


